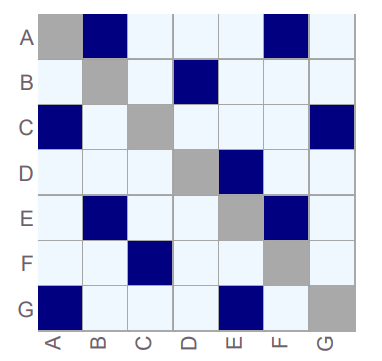
久々にDesign Structure Matrixの記事になります。 今までDesign Structure Matrixの描画にはGadfly.jlパッケージのヒートマップ機能を使用していました。
例としては以下のようなものになります。

ただこの描画方法ですとDSMの要素の有無を色でしか表現できず複雑なDSMを描画するには不得手でした。また、DSMの派生形であるMDM(マルチドメインマトリックス)の描画も難しい状況でした。
こういった状況でしたので他の描画方法を探しておりましたが、Plotly.jlのtablesが良さそうでしたので挑戦してみます。
Plotly.jl
Plotly.jlもGadfly.jl同様、Juliaの代表的な描画ライブラリです。
このパッケージのdocumentのexampleにTablesという表を描画する例がありましたのでこれを応用してみます。
下のように綺麗な表を描画できるようです。他のパッケージにはなかなかこういったものは見当たりませんでした。

DSMはどちらかといえばグラフというよりも表ですのでこのように表として出力できれば複雑な構造のDSMでも描画できそうです。
DSMの描画
結果として以下の入力から
DSM = [0 1 0 0 0 1 0;
    0 0 0 1 0 0 0;
    1 0 0 0 0 0 1;
    0 0 0 0 1 0 0;
    0 1 0 0 0 1 0;
    0 0 1 0 0 0 0;
    1 0 0 0 1 0 0];

label = ["Element 1","Element 2","Element 3",
"Element 4","Element 5","Element 6","Element 7"];
以下の出力が得られるようになりました。

念の為Gadflyの時のものを再掲しますが、Plotlyの場合元が表ですのでテキストを埋め込みやすく、結果として複雑な表を作ることができました。

ただしPlotlyにも以下のような弱点があります。
- セルを正方形にするのは手動調整になる。
- セルサイズ手動調整の融通が効かない
- スクロールが必要な程度に表が大きくなった場合、描画のバグが生じることが多い
- 静止画を出力するためには別のパッケージが必要
などとなかなか厄介な欠点を抱えておりますが、Gadflyの時よりかはまだマシかもしれません。
他にも良いパッケージをご存知の方がいらっしゃいましたらご紹介いただければ幸いです。
最後にソースコードを掲載して、今回はここまでにします。
using Plotly


DSM = [0 1 0 0 0 1 0;
    0 0 0 1 0 0 0;
    1 0 0 0 0 0 1;
    0 0 0 0 1 0 0;
    0 1 0 0 0 1 0;
    0 0 1 0 0 0 0;
    1 0 0 0 1 0 0];

label = ["Element 1","Element 2","Element 3","Element 4","Element 5","Element 6","Element 7"];


function DSM2table(DSM,label)

    (DSMsize,) = size(DSM);
    element_number = [i for i in 1 : DSMsize]
    tabledata = [label element_number editDSM(DSM)];
    headerdata = ["Label" "No" string.((element_number'))];
    return tabledata, headerdata
end

function editDSM(DSM)
    (r,c) = size(DSM);
    DSM = string.(DSM)

    for i  in 1 : r
        for j  in 1 : c
            if i == j
                DSM[i,j] = string(i)
            elseif DSM[i,j] == "0"
                DSM[i,j] = ""
            else
                DSM[i,j] ="●"
            end
        end
    end
return DSM
end

function colorDSM(DSM)
    (r,c) = size(DSM);
    fillcolor = string.(DSM);
    for i  in 1 : r
        for j  in 1 : c
            if i == j
                fillcolor[i,j] = "grey"
            else
                fillcolor[i,j] ="white"
            end
        end
    end
return fillcolor
end

function colorlabels(DSM)
    (r,c) = size(DSM);
    colorlabel = string.(ones(r,2));
    for i  in 1 : r
        for j  in 1 : 2
            colorlabel[i,j] = "grey"
        end
    end
return colorlabel
end

function fontcolor(cellsfillcolor)
    fontcolor = copy(cellsfillcolor)
    (r,c) = size(cellsfillcolor);
    for i  in 1 : r
        for j  in 1 : c
            if cellsfillcolor[i,j] == "grey"
                fontcolor[i,j] = "white"
            else
                fontcolor[i,j] ="black"
            end
        end
    end
return fontcolor
end

function fontsize(values)
    (r,c) = size(values);
    fontsize = ones(r,c)
    for i  in 1 : r
        for j  in 1 : c
            if values[i,j] == "●"
                fontsize[i,j] = 20
            else
                fontsize[i,j] =20
            end
        end
    end
return fontsize
end

function table1()
    (values,headerdata) = DSM2table(DSM,label)
    cellsfillcolor =[colorlabels(DSM) colorDSM(DSM)];
    trace = table(
        columnwidth=[5, 1],
        header=attr(
            values=headerdata,
            align="center", line=attr(width=1, color="black"),
            height = 30,
            fill_color="grey", font=attr(family="Arial", size=20, color="white")
        ),
        cells=attr(
            values=values, align="center", line=attr(color="black", width=1),
            fill_color = cellsfillcolor,
            font_color= ["white","white","black"],
            font_size = 20,
            height = 30,
            font=attr(family="Arial")
        )
    )
    p = plot(trace)


end